Contact Us


Data Analytics Training: Master Top Tools for Effective Data Analysis

Our data analytics training program unlocks potential. TechTip24 offers industry-leading data analytics training. Power BI, MySQL, Tableau, R programming, and Python are among the top data analytics tools we teach.

Gain In-Depth Expertise in Data Analytics Tools

Our data analytics training programme provides hands-on experience and practical knowledge of the best data analytics tools in the market. These sophisticated tools will help you analyse and interpret data with our experienced educators and real-world projects.

Realize the Power of Data Analytics

Our data analytics initiatives reveal how data analytics is changing businesses across industries. Our practical data analysis training prepares you for real-world problems.

Mastering the best data analytics tools gives you a competitive edge and opens doors to intriguing employment options. Our training in data analysis, business intelligence, and data scientist can help you succeed.

Join our data analytics training programme to become a proficient data analyst.

Tools covered in Data Analyst course - ExcelR
Who should do Data Analyst Course - ExcelR

Program Benefits

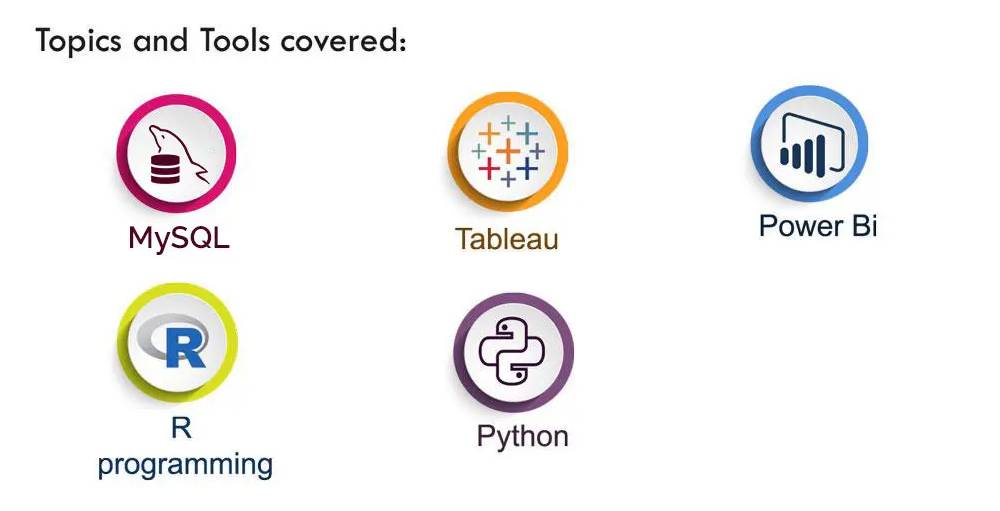
Our data analytics training programme unlocks potential. TechTip24 offers industry-leading data analytics training. Power BI, MySQL, Tableau, R programming, and Python are among the top data analytics tools we teach.

Life Time Access

Industry Relevant Curriculum

Flexible Learning

Live Doubt Solving Sessions Via Zoom

Course Completion Certificate

WhatsApp Chat Support & Premium Community Access

Instant access of practical sessions, ebooks, datasets

Complete practical and hans-on training

Resume building sessions upon course completion

Real time projects during the course

Virtual internship after completion of the training

Learn directly from Workshing Professional and Corporate Trainer - Aditi Gupta

PROGRAM CURRICULUM

  • POWER BI Session 1
  • Topics Covered:-
    • Installation
    • Import dataset
    • Make the first visual
    • Use of filters
    • Save report
  • POWER BI Session 2
  • Topics Covered:-
    • Formatting (color, size, label)
    • Change data, background, etc
    • Apply border
    • Working with data
    • Tooltip
    • Insert visual
    • Publish the report
    • Power Bi architecture
  • POWER BI Session 3
  • Topics Covered:-
    • Data preview
    • Import dataset
    • Arranging charts
    • Work with data
    • Date hierarchy
    • Data slicers
    • Table visual
  • POWER BI Session 4
  • Topics Covered:-
    • Matrix visual
    • Structuring data
    • Row headers
    • Formatting values
    • Sub-category
    • Copying visual
    • Table visual
  • POWER BI Session 5
  • Topics Covered:-
    • Join
    • Inner join
    • Left outer join
    • Right outer join
    • Full outer join
    • Join data/table
    • Power query editor
    • Merging table
    • Donut chart
    • Count and count distinct
    • Add conditional column
  • POWER BI Session 6
  • Topics Covered:-
    • Dax function
    • Round function
    • Find length of any column
    • Assignment
  • POWER BI Session 7
  • Topics Covered:-
    • Types of data
    • Import new data set
    • Cleaning data
    • Analyzing data
    • Difference b/w structured and unstructured data
    • Convert unstructured data to structured data
    • Remove top/bottom rows
    • Remove null values and error
  • POWER BI Session 8
  • Topics Covered:-
    • Making calculated column - DAX
    • Change data into reports
    • Measures and Create Measures
    • Quick Measures
    • Make column using “if else” condition - DAX
  • POWER BI Session 9
  • Topics Covered:-
    • Sales analysis dashboard
    • Making different pages
    • Making different reports
    • Q & A visual
    • Make different background
  • POWER BI Session 10
  • Topics Covered:-
    • Area
    • Count and count distinct
    • Q & A
    • Card visual
    • Stack column
    • Map visual
  • POWER BI Session 11
  • Topics Covered:-
    • KPI visual
    • “if else “ conditions advanced - DAX
    • Track performance
    • Analytics pane
    • Prediction Forecasting
  • POWER BI Session 12
  • Topics Covered:-
    • Generate Microsoft account
    • Power bi service
    • Login using Microsoft account
    • Map visuals
    • Import data - Power BI Service
  • POWER BI Session 13
  • Topics Covered:-
    • Make analytical dashboard
    • Apply filters on specific visual
    • Manage role
    • Tooltip Visuals
    • Make report
  • POWER BI Session 14
  • Topics Covered:-
    • Sign in power bi
    • Difference between reports and dashboard
    • Publish report in power bi
    • Share dashboard & reports - Dynamic and Static
  • POWER BI Session 15
  • Topics Covered:-
    • How to export report from power bi service to powerpoint
    • Power BI Architecture
    • Features of power bi like data scheduling and refreshing, options to share the reports (QR CODE, Via Mail)
  • POWER BI Session 16
  • Topics Covered:-
    • Reports and dashboard-Real Time Scenarios
    • Assessments & Project
  • POWER BI Session 16
  • Topics Covered:-
    • M-Query Introduction
    • M-Code
    • M-Code Practical
    • Industry Use
    • Power BI - Advance M-Code
  • POWER BI Advance - Session 17(Part2)
  • Topics Covered:-
    • Advance Data Modelling
    • Cardinality - Data Modelling
    • Cross Filter Direction - Data Modelling
    • Active & Inactive Relationship
  • POWER BI Advance - Session 18
  • Topics Covered:-
    • Dashboards - Power BI
    • Date Table - Power BI
    • Automate Date Table
    • Active & Inactive Relationship
  • POWER BI Advance - Session 19
  • Topics Covered:-
    • DAX
    • Date Table - Power BI
    • Aggregation Functions
    • Active & Inactive Relationship
  • POWER BI Advance - Session 20
  • Topics Covered:-
    • Advance Visuals - Power BI
    • Multi row Visual
    • Decomposition tree Visual
    • Smart Narrative -Visual
    • Animated bar chart -Visual
  • POWER BI Advance - Session 21
  • Topics Covered:-
    • DrillUp
    • Drill Through
    • Decomposition tree Visual
    • Smart Narrative -Visual
  • POWER BI Advance - Session 22
  • Topics Covered:-
    • Advance Bookmarks
    • Practical Exposure
    • Bookmarks Grouping and Ungroup
    • Apply Bookmarks on buttons
  • POWER BI Advance - Session 23
  • Topics Covered:-
    • Advance Bookmarks
    • Edit Parameters
    • Small Multiples
    • Home Button in Reports
    • Manage Roles
  • POWER BI Advance - Session 24
  • Topics Covered:-
    • Enter Data in Power BI
    • Make report on that data
    • Auto Refresh in Power BI
    • Custom Visual
    • Advance Donut and Pie Chart
    • Automatic Top/Bottom Filters
  • POWER BI Advance - Session 25
  • Topics Covered:-
    • Connection with Google Sheets
    • Automatic refresh data
    • Google sheets auto refresh in POWER BI
  • POWER BI Advance - Session 26
  • Topics Covered:-
    • KPI Visuals
    • Target v/s Actuals KPI Visuals
    • Power BI Service
    • Row Level Security
    • Manage Roles/View As
  • POWER BI Advance - Session 27
  • Topics Covered:-
    • Advance DAX
    • Advance DAX - Ebooks
    • Date Sorting (Jan - Dec)
    • Introduction to SSMS (Sql Server Management Studio)
  • POWER BI Advance - Session 28
  • Topics Covered:-
    • SSMS/SSAS/SSIS/SSRS
    • Advance DAX - Ebooks
    • Connecting Power BI with SQL
    • Import Query
    • Direct Query
    • Assessment
  • POWER BI Advance - Session 29
  • Topics Covered:-
    • Important DAX Functions
    • Date and Time Intelligence
    • Functions
    • LinkedIn Analysis - Real time dashboard
    • How to download LinkedIn Live Data
  • POWER BI Advance - Session 30
  • Topics Covered:-
    • Part 1: Excel Automation
    • Part 2: XML Automation
  • POWER BI Advance - Session 31
  • Topics Covered:-
    • Convert Data Labels into
    • Lakhs and Crores
    • Data Labels Customization
  • POWER BI Advance - Session 32
  • Topics Covered:-
    • Power BI Updation
    • Power BI Updated Features
    • Power BI Updated Sessions
  • POWER BI Advance - Session 33
  • Topics Covered:-
    • Power BI Guide - Helpful For Interview Prospective
    • Sample Real Time Projects
  • POWER BI Advance - Session 34
  • Topics Covered:-
    • Row Level Security(RLS)
    • Sample Real Time Projects
    • Scheduling and Refreshing
  • POWER BI Advance - Session (35-40)
  • Topics Covered:-
    • Resume Building
    • Interview Quesions
    • Profile Optimization
    • Job Assistance
  • POWER BI Upcoming Advance Sessions
  • Topics Covered:-
    • Session on New Updates in Power BI
    • Session will keep on adding in portal, you all have life time access.
    • With proper datasets and materials.

  • SQL Session 1
  • Topics Covered:-
    • Introduction to SQL
    • SqlLiteOnline
    • Insert
    • Create
    • Update
    • Logical Operators
    • Other Commands
  • SQL Session 2
  • Topics Covered:-
    • Functions in SQL(count, average,sum, min, max)
    • Alias
    • Subqueries
    • Introduction to joins (Inner, Left, full, Right)
  • SQL Session 3
  • Topics Covered:-
    • Inner Join
    • Left Join
    • Right Join
    • Order By
    • Limit
    • Sort Data
    • Other Commands
  • SQL Session 4
  • Topics Covered:-
    • Join three tables
    • Real-life question
    • Scenarios
    • Decision Making
    • Analysis Queries
  • SQL Session 5
  • Topics Covered:-
    • Questions
    • Advance Join
    • Advance Analysis
    • Project

  • Tableau Session 1
  • Topics Covered:-
    • Why Tableau?
    • Installation of Tableau
    • Sample Dashboard & Working
    • Connecting to Data Source
    • Introduction to Worksheet
    • Make your first visual
  • Tableau Session 2
  • Topics Covered:-
    • Working with Data fields
    • Marks Section in Tableau (Colour, Size, Label, Detail, Tooltip, Path)
    • Working with all of them
    • Customized Tooltip
    • Advanced Graphics
  • Tableau Session 3
  • Topics Covered:-
    • Practical Questions
    • Map Visuals- Real Axis
    • Count v/s count distinct
    • Arithmetic Operator
    • Set & Groups- Filters
  • Tableau Session 4
  • Topics Covered:-
    • Introduction to Pages
    • Animated Visuals
    • Advanced filters (General, WildCard, Conditions, Top)
    • Calculated Fields
    • Assessment
  • Tableau Session 5
  • Topics Covered:-
    • Function to make calculated fields
    • If else condition
    • Working with calculated fields for advance decisions
    • Calculated Fields
    • Discrete & Advanced Date Type
  • Tableau Advance Session 1
  • Topics Covered:-
    • Introduction to Analytics forecast/Prediction Analysis
    • Trendlines
    • Cluster
    • Create Donut chart
    • Joins in Tableau
  • Tableau Advance Session 2
  • Topics Covered:-
    • Introduction to Analytics forecast/Prediction Analysis
    • Dashboards in Tableau
    • Sample Dashboard Template
    • Overall Industry Analysis dashboard
    • Practice Sample Dashboard - Assessment

  • R Session 1
  • Topics Covered:-
    • Introduction
    • Installing R on your computer - Using R Studio
    • Getting started with the R environment
    • Reading data from a spreadsheet
    • Using and managing packages
    • Installing Libraries
  • R Session 2
  • Topics Covered:-
    • Operations, Functions, and Import Database
    • Calculating frequencies
    • Save and Designing of Charts for reporting
    • Modifying and Filtration of Data
  • R Session 3
  • Topics Covered:-
    • Recoding variables
    • Computing new variables
    • Functions to Filter Data in R
    • Procedures and Methods to modify data in R
  • R Session 4
  • Topics Covered:-
    • Charts for Associations
    • Creating simple bar charts of group means
    • Creating scatter plots
  • R Session 5
  • Topics Covered:-
    • Creating scatter plot matrices
    • Creating 3D scatter plots
    • GGPLOT
    • Statistical Analysis using R
    • Maximum and Minimum displacement
    • Quartile
    • SD
  • R Session 6
  • Topics Covered:-
    • Mean, Mode, Median
    • Percentile
    • Functions to perform Statistical Analysis in R
    • Reading, Accessing, and Summarizing Data in R
    • Calculating correlations Computing a regression
  • R Session 7
  • Topics Covered:-
    • Creating crosstabs for categorical variables
    • Logical Operations in R
      • less than
      • less than or equal to
      • greater than
      • greater than or equal to
      • exactly equal to
      • not equal to
      • Not X XORY X AND y
  • R Session 8
  • Topics Covered:-
    • Analytics using R
    • Dplyr package in R
    • Mutate and Summaries Functions in R
    • Analytics functions in R
    • Combine Commands for advance analysis of data
    • Real - Life data Analysis Using R
    • R for Business Analytics
  • R Session 9
  • Topics Covered:-
    • Data Dashboard Representation using R
    • Plotly Package
    • Flex Dashboard Presentation
    • R Markdown
  • R Session 10
  • Topics Covered:-
    • Hypothesis Testing
    • Independent Sample T Test
    • ANOVA Analysis
    • P-Values
  • R Session 11
  • Topics Covered:-
    • Predictive Analytics using Linear Regression
  • R Session 12
  • Topics Covered:-
    • Project Discussion and Submission

  • Python for data science - introduction
  • Topics Covered:-
    • Overview of Python
    • Why learn Python
  • Keywords and identifiers
  • Topics Covered:-
    • Comments, indentation, and statements
    • Variables and data types in Python
    • Standard Input and Output
    • Operators
    • Control flow: if-else, while loop, for loop, break and continue
  • Python for data science - Data structure
  • Topics Covered:-
    • Lists, Tuples
    • Sets, Dictionary
    • Strings, Comprehensions
  • Functions
  • Topics Covered:-
    • Definition, Types of functions
    • Function arguments
    • Recursive functions
    • Map, reduce, filter, and Lambda functions
  • Oops and file handling
  • Topics Covered:-
    • Understanding the Object-Oriented Concepts
    • Modules Used in Python, The Import Statements
    • Package Installation Ways, File Handling, Errors, and Exception Handling
  • Numpy
  • Topics Covered:-
    • Introduction to NumPy, Creating NumPy Arrays
    • NumPy Indexing and Selection
    • NumPy Operations.
    • Visualization using Numpy
  • Pandas
  • Topics Covered:-
    • Introduction to Pandas, Series
    • DataFrames, Basic Properties
    • Key Operations on Data Frames
    • Visual Using Pandas
  • Statistics
  • Topics Covered:-
    • What is Data? Understanding the Data and its elements.
    • The measure of Central Tendency - Mean, Median, Mode . The measure of Dispersion- Standard Deviation, Variance, Range, and IQ
    • Distribution, Hypothesis Testing, P- Value
  • Visulization
  • Topics Covered:-
    • Visualization Using Matplotlib
    • Seaborn
  • Linear regression
  • Topics Covered:-
    • Introduction to ML - What, Why and Types, Bias Variance Trade- off
    • Theoretical understanding of Linear Regression Model
    • Linear Regression Model implementation using scikit-learn
  • Logistic regression
  • Topics Covered:-
    • Theoretical discussion on Logistic Regression, conf. mat, TP, TN, Accuracy, Specificity, etc.
    • Logistic Regression Model implementation using scikit-learn.
  • K Nearest Neighbours
  • Decision tree and random forest
  • Real time projects and assessments

ADMISSION DETAILS

FEE DETAILS
Rs 12,999 Rs 23,236
  • Data Analytics Corporate Training Program
  • 40 hrs power bi content
  • 10 hrs sql
  • 15 hrs tableau
  • 15 hrs R
  • 10 hrs Python
  • Resume building sessions,
  • Interview Preparation,
  • Virtual Internships
  • Job assistance
  • Dedicated group for queries
  • Live Doubt solving sessions
  • Once you enroll you will get instant mail, then you can access the course from TechTip24 App and from Website as well, Using the below links.
Click here and Register Now at 12,999!

FAQs

  • No, Coding Required.

  • With Diff domain or with Non-IT Background as well you can start learning, as everything from scratch.

  • Our data analytics training programme provides hands-on experience and practical knowledge of the best data analytics tools in the market. These sophisticated tools will help you analyse and interpret data with our experienced educators and real-world projects.

  • Yes, you can start as a freelancer.

  • No, to start learning Data Analytics and do get a job in this industry there is no age criteria.

  • The queries will address in four main modes:-
    • Email
    • WhatsApp Mentor Access
    • Community group
    • Live doubt solving sessions every Wednesday and Saturday (8-9:30 PM) up to 8 Months.

  • No, to start learning Data Analytics and do get a job in this industry there is no age criteria.

  • Yes, once you enroll you will get lifetime access of everything.

  • Yes, we do have

  • It will be a million dollar industry. Hiring managers are looking for Data driven managers for better solutions. Irrespective of any domain you are from, in any field you are exp in, you need to have expertise in atleast one data analytics tool.

  • Yes you can learn with Non – IT Background.